
FS02: Multispectral & Hyperspectral Survey
Multispectral and hyperspectral sensing techniques provide a powerful insight into land and vegetation conditions. The use of sensing with drones provides enhanced benefits of resolution and coverage. While many of the outcomes are robust, the science is still finding new ways of gaining more insight.
Sensing Principles
Multispectral sensing involves measuring the reflectance of selected bands of the electromagnetic light spectrum (visible and non-visible). The technique uses light filtering, so the imaging system only receives electromagnetic light in the specific wavelengths (bands). Hyperspectral sensing is similar but uses thinner spectrum bands across a much wider range to provide far greater detail.
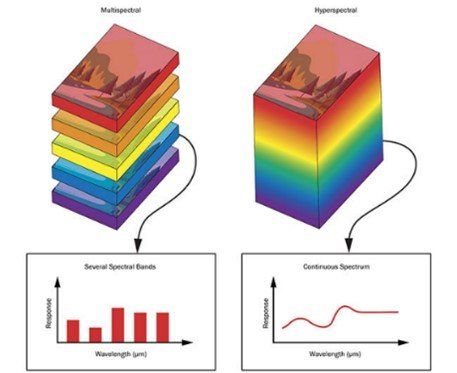
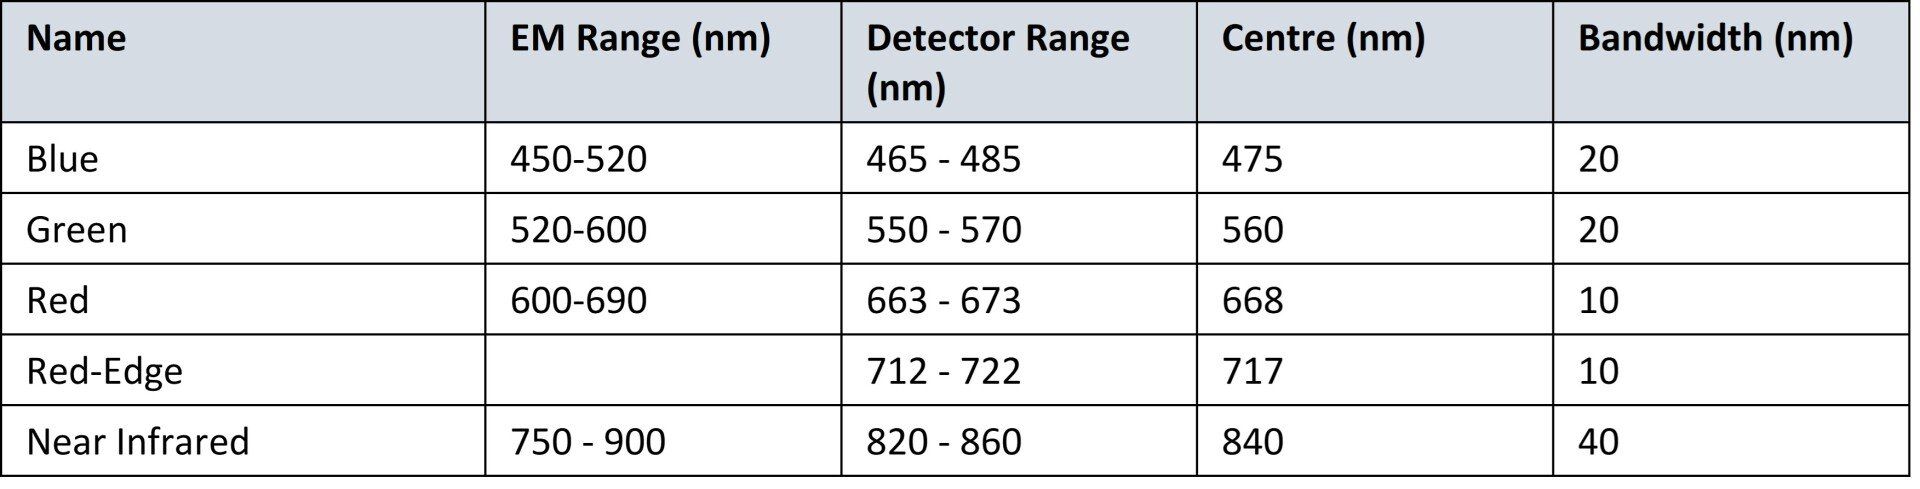
A typical multispectral sensor will obtain images in 4 or 5 spectrum bandwidths, as shown in the following table (Micasense Rededge MX).
Why we use multispectral
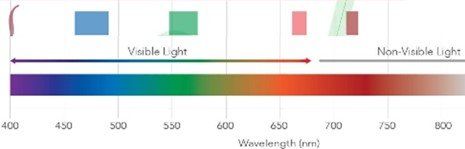
Multispectral sensing is particularly useful for assessing plant health. This is because we know that chlorophyll has maximum absorption in the red waveband and therefore red light does not penetrate very far past a few leaf layers. On the other hand, light in the green and red-edge can penetrate a leaf much more deeply than blue or red light so a pure red-edge waveband will be more sensitive to medium to high levels of chlorophyll content, and hence leaf nitrogen, than a broad waveband that encompasses blue light, red light, or a mixture of visible and NIR light.
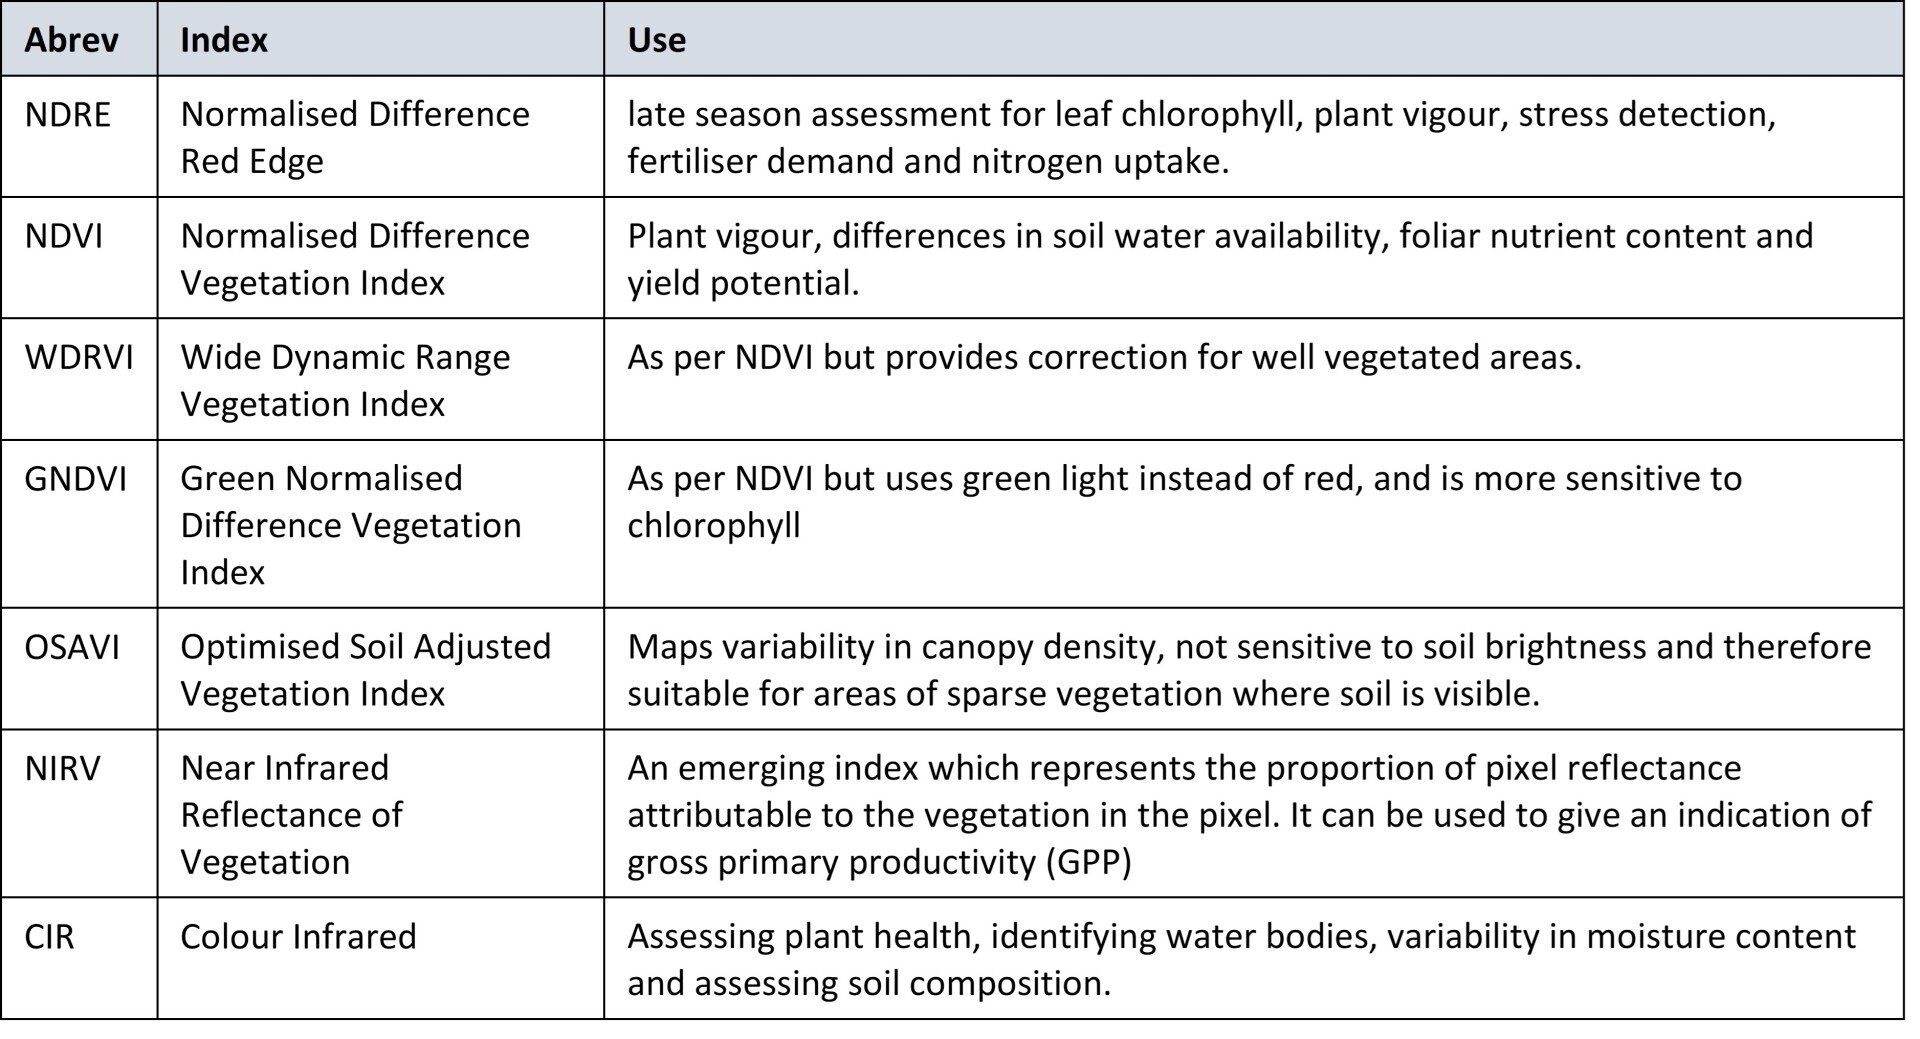
Vegetation indices are used to take advantage of these natural plant features and are calculated on the absorbance, reflectance, and radiance of light band ranges. Vegetation indices apply different light band formulas to compensate for seasonal and field conditions providing similar but more bespoke outcomes. The following pertinent vegetation indices have been selected to provide an initial baseline for health assessment and future comparison.
The survey
data can be output into full pixilated formats to support analysis and assessment of the variations deriving from application of the multispectral indices. The results can be averaged for similar habitats (e.g. productive grass, pasture, woodland) or field areas after non-productive or field boundary areas have been excluded to allow overall field based comparisons. This process is used to support the identification of areas or fields for improvement or prioritised field management.
However, the indices can also be used to support assessment of other land based characteristics. This includes using data variability to support determination of bio-diversity, identification of similar characteristics in support of habitat mapping and the identification of moisture and water features to help with drainage and hydrology. In addition, characteristics of the soil (mineralisation, clay/silt/sand) can be determined at broad levels. The assessment process can be extended and enhanced by using hyperspectral sensing. This process is akin to DNA fingerprinting. If we know the electromagnetic spectrum reflectance of a feature, object or plant then we can find it using hyperspectral sensing.
Surveying Processes
The survey process follows the same principles as that of photogrammetry. The key difference is that the field of view is smaller and the overlap between images typically needs to be greater. In addition, frequent calibration is required prior to each flight or mission and on completion of the mission flight using a radiometric calibration target. The target helps measure the percentage of reflection in each band and allows corrections to be made, ensuring consistent and accurate data based on survey conditions.
Surveys should optimally be undertaken during greater levels of illumination when the sun is at its apex and is consistent. Changing/variable light conditions, shading affects caused when the sun is too low on the horizon and changing moisture conditions from rain showers will result in poor quality survey outcomes.
Surveying Examples
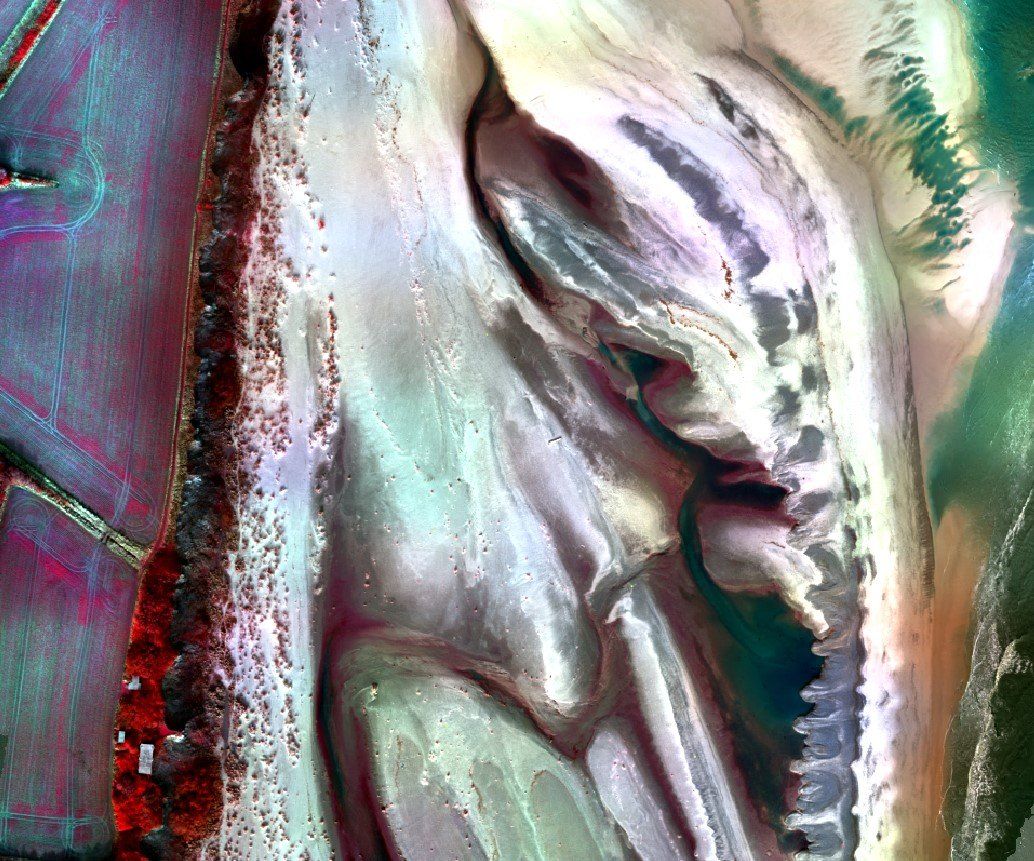
CIR: Orthomosaic image of a coastal environment beach formation area shows healthy vegetation in bright red, water as black, siltier sediment as green and grey, and sand as white. This is particularly useful in assessing the constituents of growing and developing habitats.
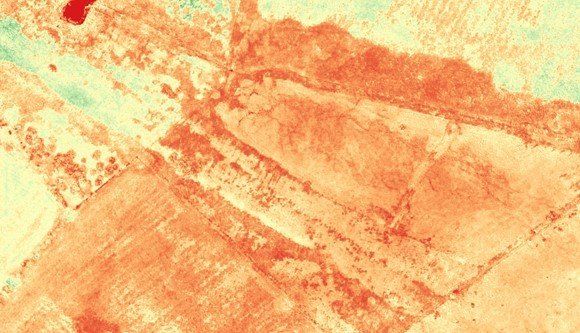
OSAVI: Orthomosaic extract of a large agricultural area (same area as above for comparison) highlighting areas where vegetation is sparse and highlighting water features.
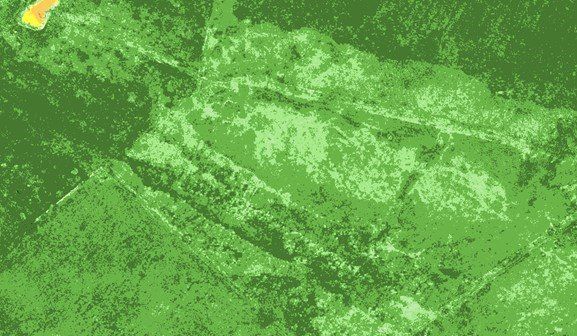
NDVI: Orthomosaic extract of a large agricultural area showing variable plant health and areas impacted by poor drainage.
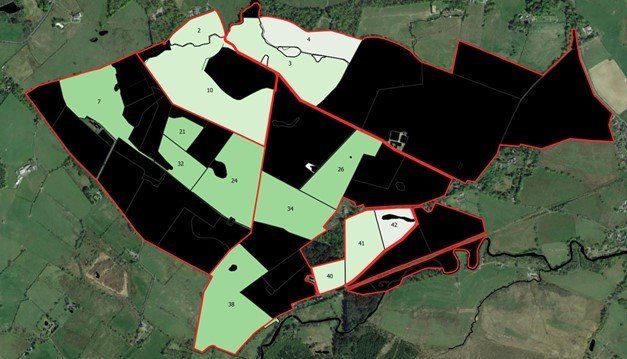
NDRE: Field averaged NDRE where similar farm fields are then assessed on the basis of the average NDRE pixelated calculations (removing data from field boundaries).
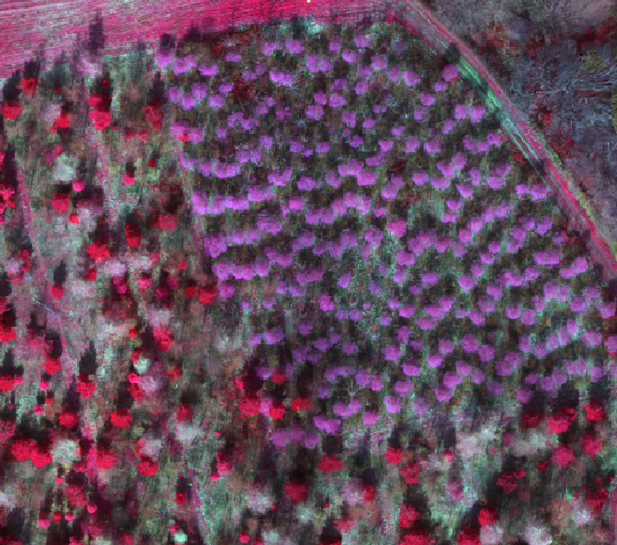
CIR: Orthomosaic of a Forest area highlighting differences from tree species and variations in bare soil conditions.
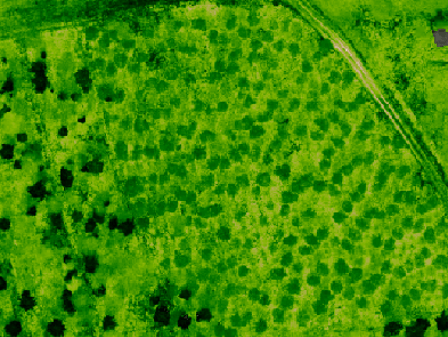
NDVI: Orthomosaic of forest area (as above for comparison) which helps determine the biomass and the relative health condition of the trees and forest area.
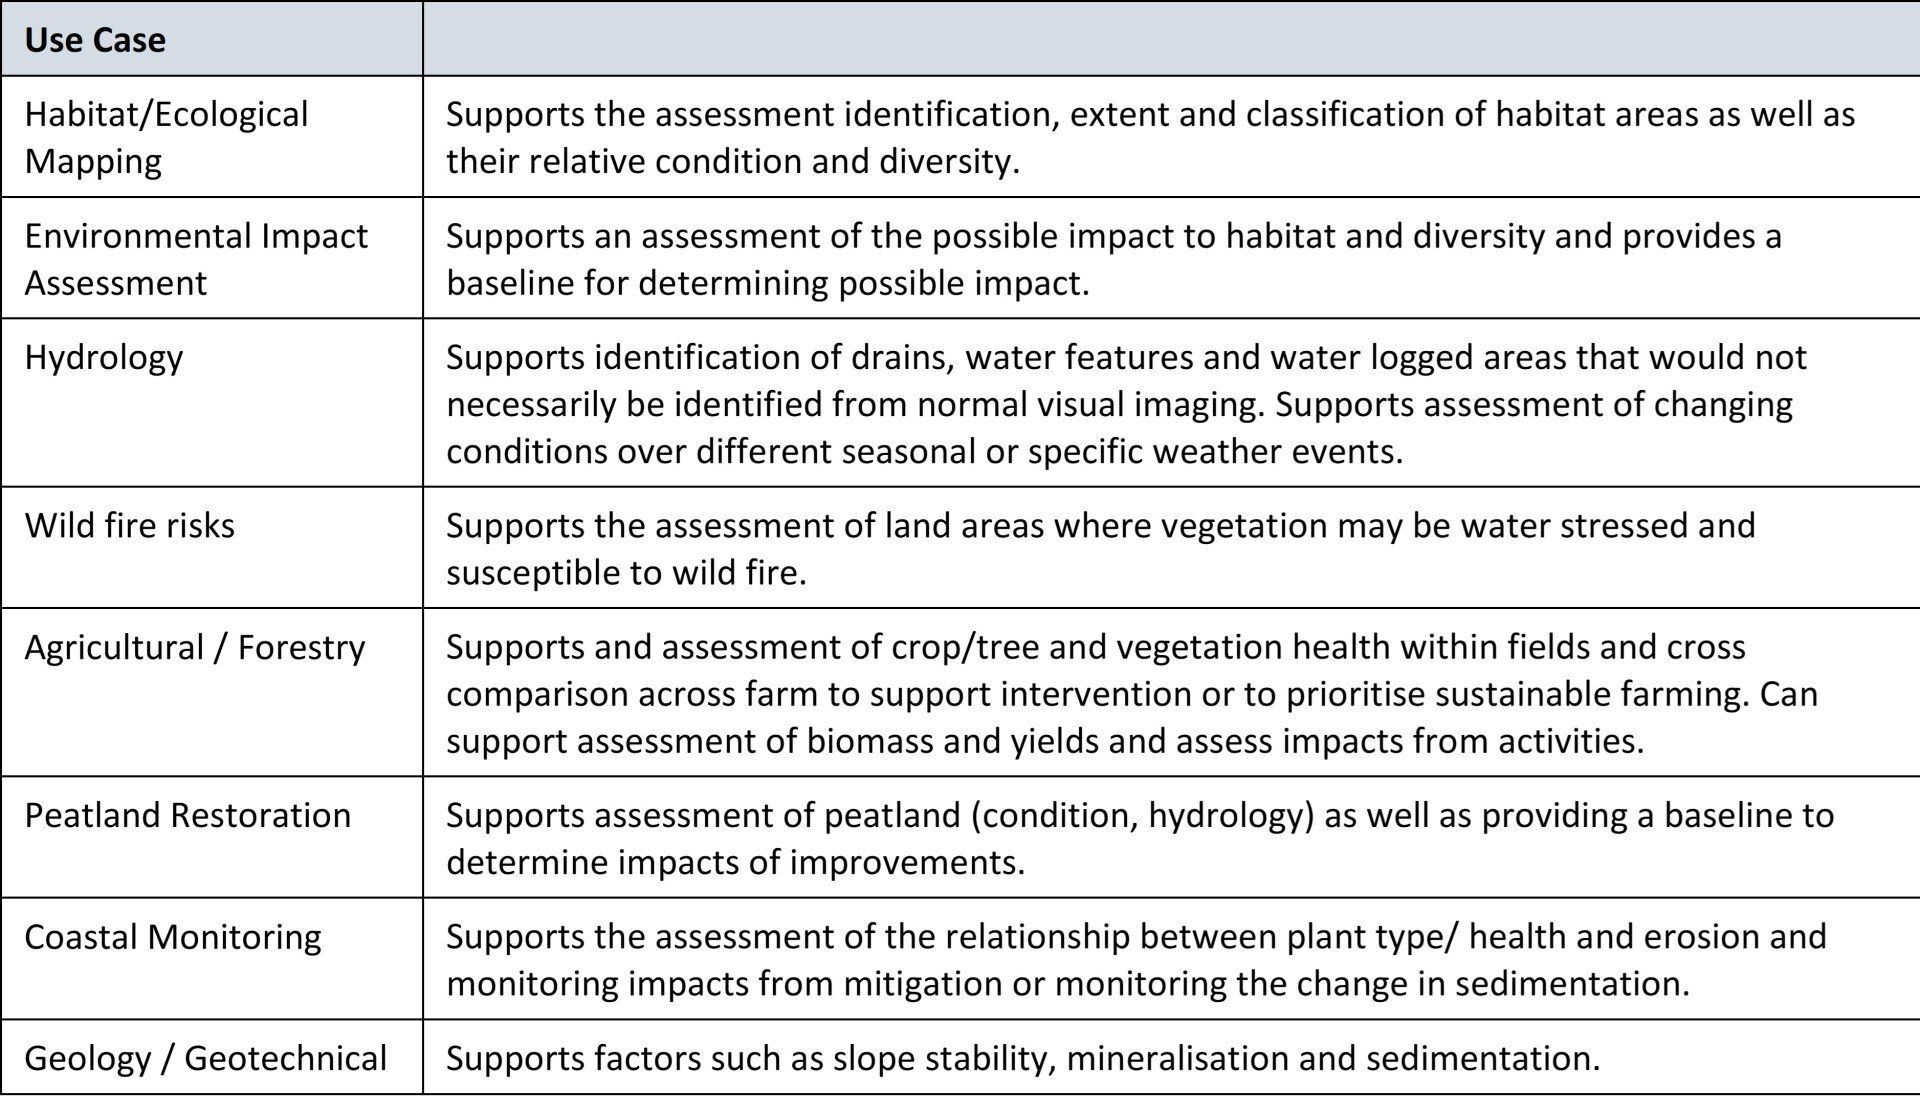
Use Case Applications
Multispectral surveying can provide a range of benefits to various use case applications. The science and possibilities are increased significantly through the application of hyperspectral surveying processes.
Land Condition Assessment
For optimum results use multispectral survey sensing with LiDAR, Photogrammetry and Radiometric thermal sensing. The data used from these various techniques using light can be used to cross reference and enhance the data outcomes, particularly where there are multiple or complex needs and requirements.