
BS06: Modelling
Visual representations in 3D are powerful tools to support dissemination of complex and data rich survey outcomes supporting both client and stakeholder engagement as well as providing a focus for supporting evidence based decision making.
Definition
Models are constructed as a visualisation tool to allow dissemination of large and complex datasets to an audience that often does not have the powerful software tools or expertise to interrogate the data. Models are normally contextualised 3D representations with different levels of functionality and access to appeal to different audiences. Models are typically provided along with raw, processed and GIS data to support internal and external engagement and management.
Typical Model Scenarios
There are a range of possible scenarios, including:
Photogrammetric Visualisation
At the most basic level, photographic images can be 'stitched' together using photogrammetry to develop a 3D digital surface model. This can be enhanced using higher resolution imaging, greater overlapping images, lower flight and optimal light conditions. To make the model useful in real world analysis the data can be positioned and corrected through the combination use of GPS (flight, ground station, ground control points). The latter also allows you to determine the relative errors in the survey. So, from a simple basic model to a survey grade model.
A 3D visualisation model can be enhanced through the use of drone lidar. Since lidar can penetrate vegetation and survey at far greater points (per m2) there is a greater representation difference between terrain and surface, rendering a point cloud that can be developed into a higher grade model. Colourisation and texturing can be achieved by using integrated cameras at the time of survey. The workflow moves from point cloud to orthosomaic and then the developed outcome as a 3D model. A combination of global positioning systems, inertial navigation, ground control station and ground control points allow the model to be corrected to real world coordinates. The downside to using lidar is that the data volumes and processing are much higher.
Data Visualisation
Surveys tend to generate valuable data, most of which needs to be visualised. Survey grade data will require detailed correlation with flight GPS and ground truthed GPS to support accurate positioning, error management and cleansing. Data from photonics may require corrections and cleansing based on reflectance changes, variable light conditions or other factors. The processing requirements are much more intensive often involving multiple workflows.
The base solution for data outcomes is using GIS. However, visualisation of data can also be expressed as a more advanced 3D model from software such as Blender.
However, surveys typically require incorporation of ground truthing, corrections and error management which requires detail correlation of the flight GPS and ground control GPS to ensure that the model is as accurate as possible. The processing increases for lidar, multispectral and thermal where position and impacts from changing light conditions can increase the requirement for data cleansing.
Games Engine
Game engine (e.g. Unreal Unity) allows compression and occlusion tools to support better optimisation of processing and visualisation. Models are typically very large in size, while the user does not necessarily need continuous full resolution of the entire model.
Simulations
Extending the use of the games engine the model can be placed into context with a real time environment (including sun, sky, tides and weather) as well as landscape rendering of surrounding areas. More advanced solutions can include temporal shift to reveal changes in time or the addition of a 3D representation of a proposed development feature. Further solutions can be embedded to allow some form of gamification. The benefit here is that the simulation tool can allow visualisation from any point and interaction with key features.
Further analysis could be possible by using such techniques including shadow/right to light, line of sight, solar gains etc.
Delivery Outcomes
There are multiple possible outcomes depending on the intended audience, size of the project and the level of resolution required.
GIS
GIS is particularly useful where data needs to be geolocated. Most GIS systems work best in 2D, but various plug-ins can now allow generation and visualisation of data in 3D. The down side is that to use it effectively the user requires a full licence including plug ins to optimise their use. The upside is that there are some cost solutions for making data public or in using free software.
BIM
BIM models are mainly for building structures and require much post visual model processing to identify and add data layers (doors, windows, materials) to a visual model using CAD/Revit. The intensity of the process relates to the Level of Detail (LoD) typically required for the final engineering model.
Web Based
Many models can now be exported and used within html for web based applications. This is particularly useful for smaller models and where there are many stakeholders where visualisation and basic interactions are required.
Digital Twin
A digital twin is essentially a cloud hosted solution with a data manager and a web front end. The digital twin offers more data interaction but requires more processing and management. This is a good solution for monitoring projects or for asset management where there are multiple stakeholders.
Bespoke
We can employ workflow solutions using game engine technology hosted in the cloud with direct access. The models are then typically set with a bespoke range of controls for navigation and management. Larger or more complex projects can be segmented and yet seamlessly linked (like scenes) to manage processing requirements.
The use and application of games engine technology can then unlock further opportunity for dissemination of the models and data for engagement. For example the models can be used with virtual or augmented reality (or mixed reality) solutions.
Surveying Examples
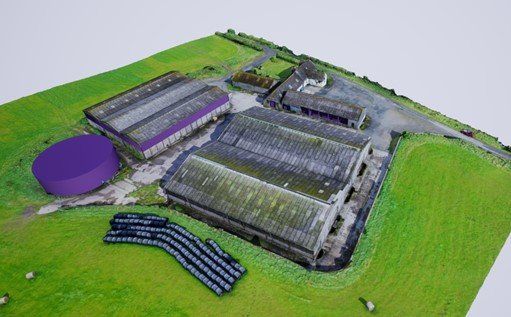
Photogrammetry survey of a farm house building, pushed into a games engine (Unity) to allow the user to have 360 degree navigation and occlusion rendering.
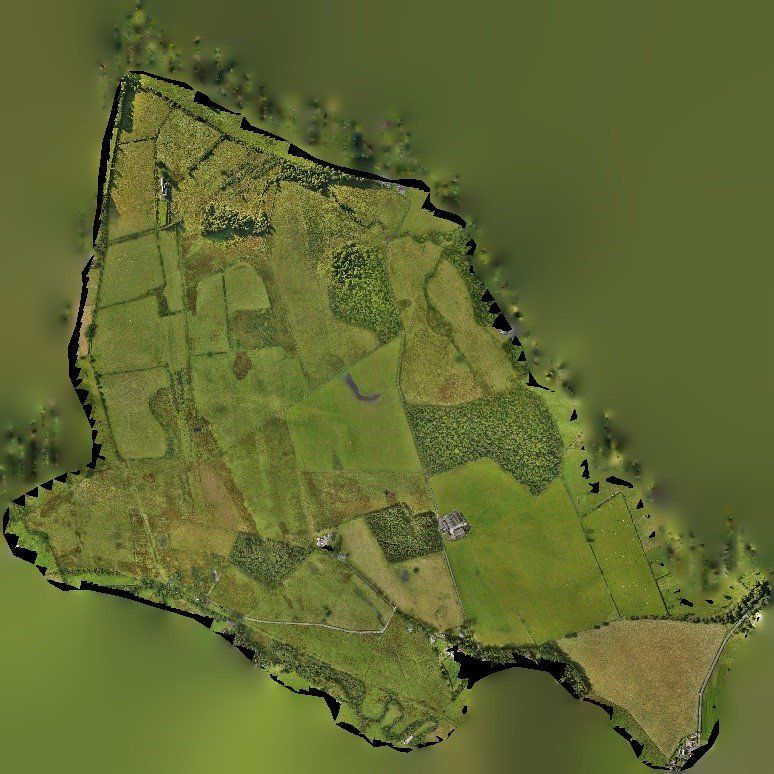
Same area as example 1, but for 350 ha area.
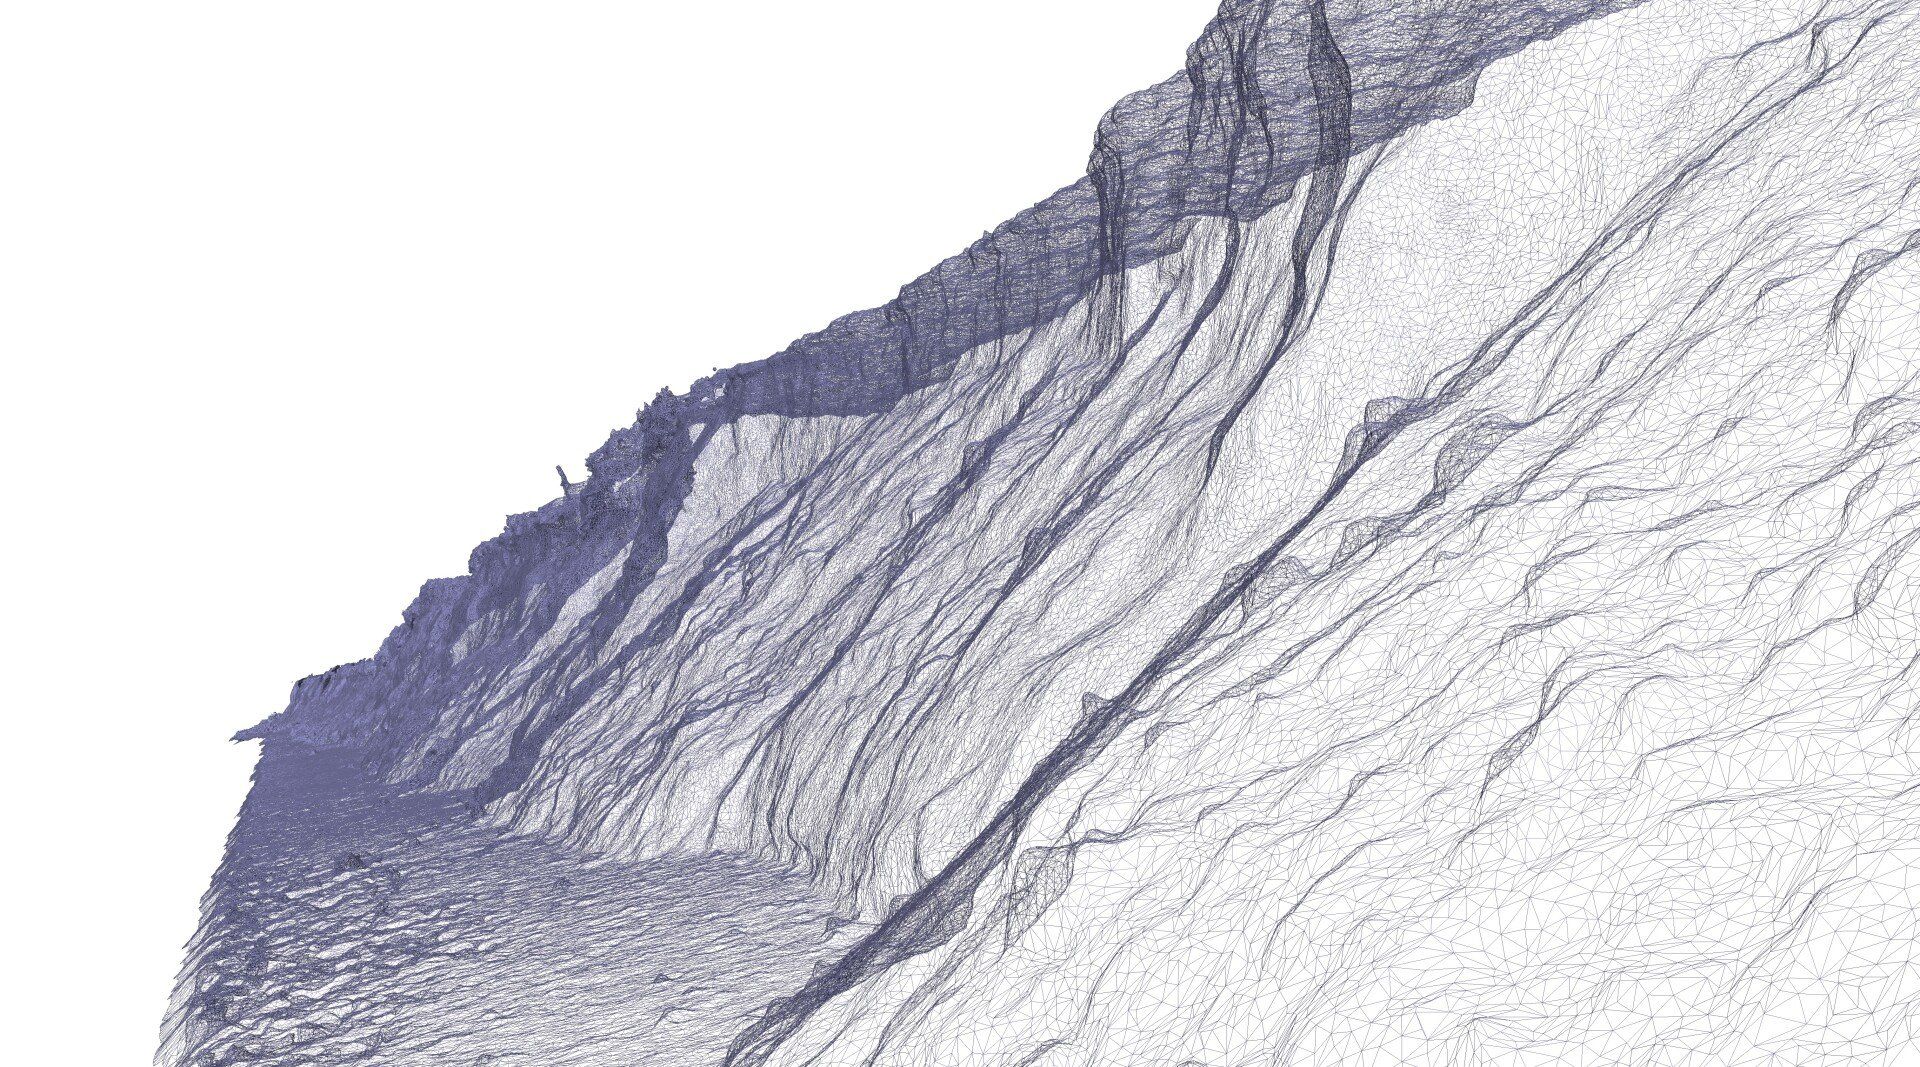
Mesh model developed to allow calculation and show volume changes.
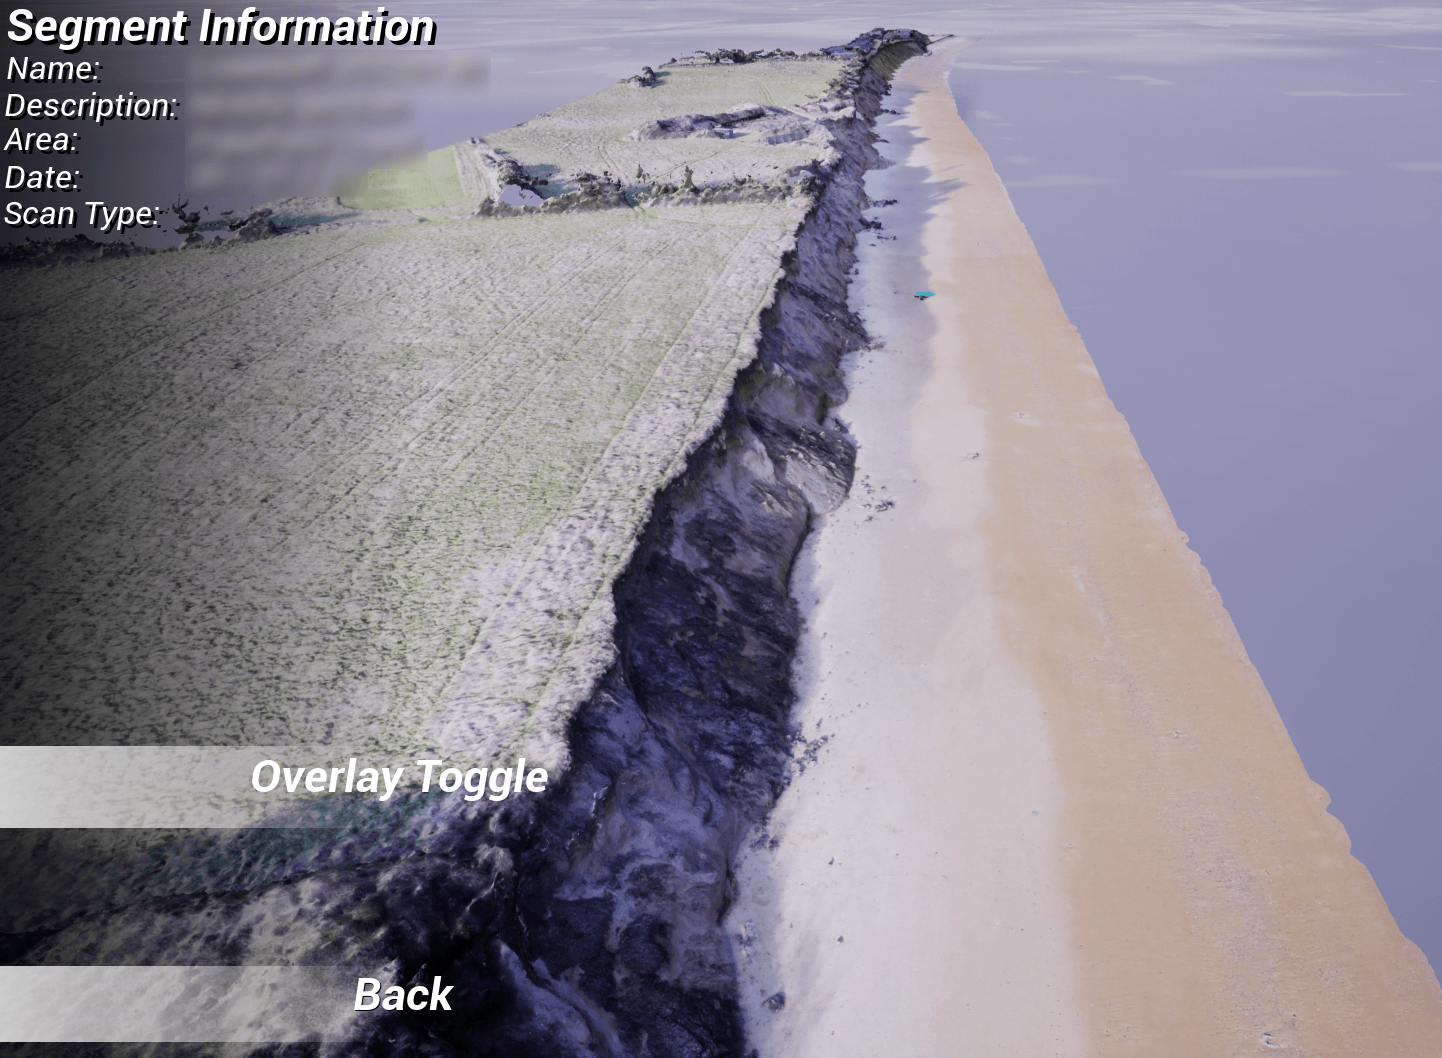
Coastal survey model using Unreal games engine technology to allow a bespoke front end high definition rendering and navigation with a toggle feature to show temporal changes between surveys
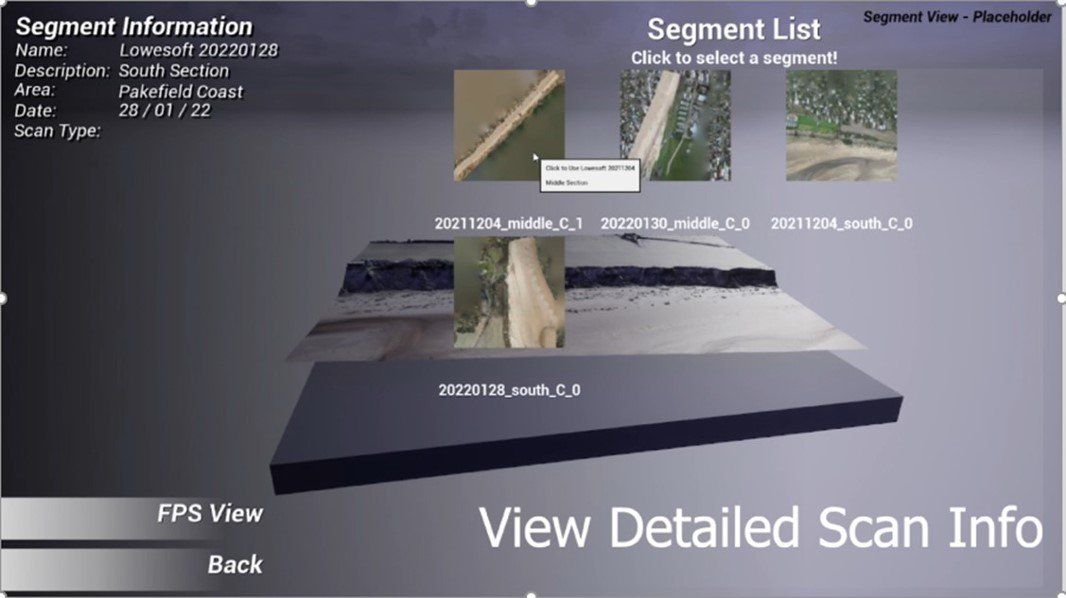
Large survey and data volumes segmented and optimised using games engine (Unreal) into a cloud based solution for managing monitoring outcomes from coastal survey.
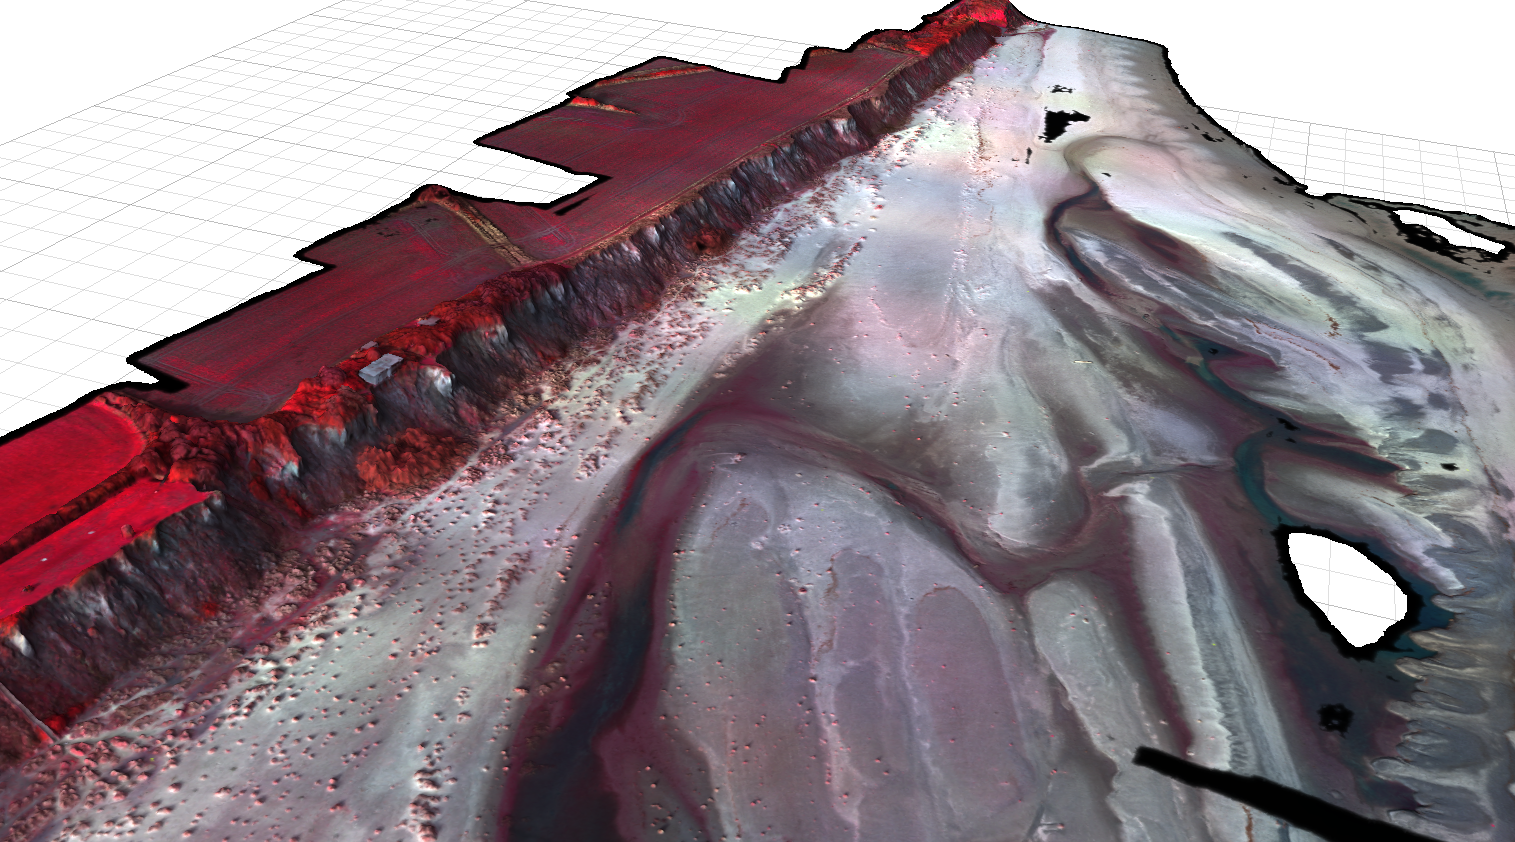
Multispectral survey rendered into a 3D model to support user engagement.
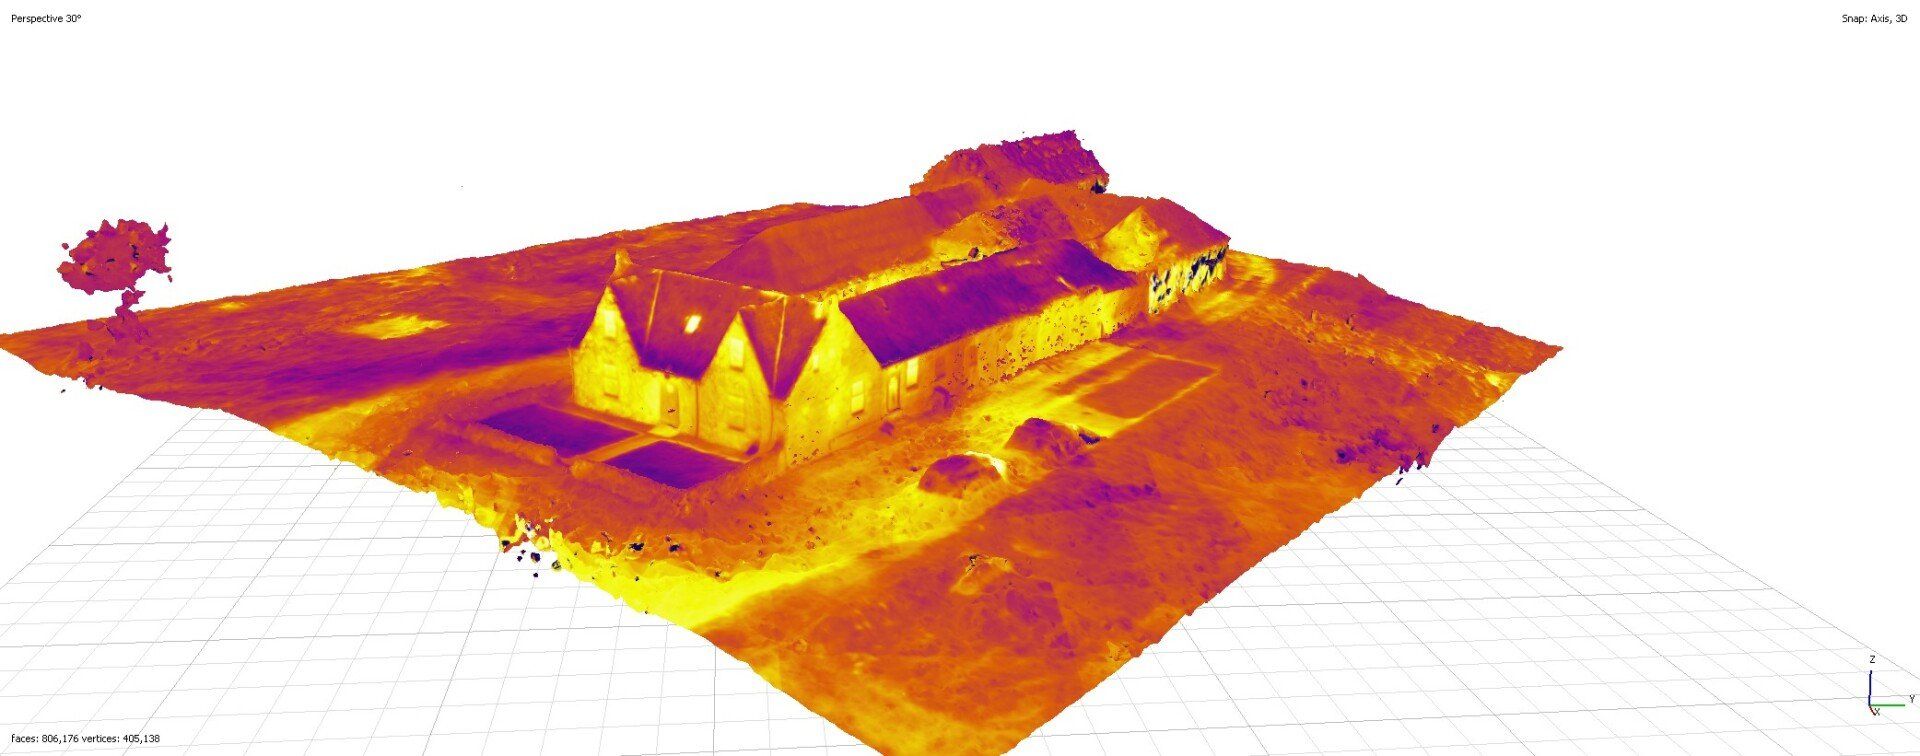
Thermal survey data rendered into a 3D image to allow detailed examination of all external building areas.
See Also